
The Chain Is Always Longer Than It Looks
The assembly line does not negotiate with the sea.
On March 23, 2021, at approximately 05:40 UTC, the container ship “Ever Given” ran aground in the southern section of the Suez Canal. Within hours, the market had responded with the confidence of a system that believes speed and intelligence are the same thing. Brent crude spiked 6%. Tanker rates tripled within two days. Clean, efficient, first-order reactions.
The chain, however, was just beginning.
By March 29th, the day the ship was refloated, 369 vessels sat waiting. Six days into the crisis, BMW and Volkswagen began signaling production halts. The just-in-time buffer for wiring harnesses and semiconductors sourced from Southeast Asia had run dry. No buffer. No output.
Two months after the canal reopened, the third-order effect arrived in Rotterdam and Antwerp. The delayed backlog reached port simultaneously, overwhelming berth capacity, and inland trucking rates across the Eurozone spiked 15%. The fourth-order effect was quieter and more permanent: a structural migration by global logistics firms from just-in-time to just-in-case inventory management, permanently increasing working capital requirements for industrial companies across the S&P 500.
The market priced the grounded ship in minutes. It took months to price the inventory philosophy that replaced it.
This is the core reality of global markets. The chain is always longer than it looks. And most participants are only interested in the first link.
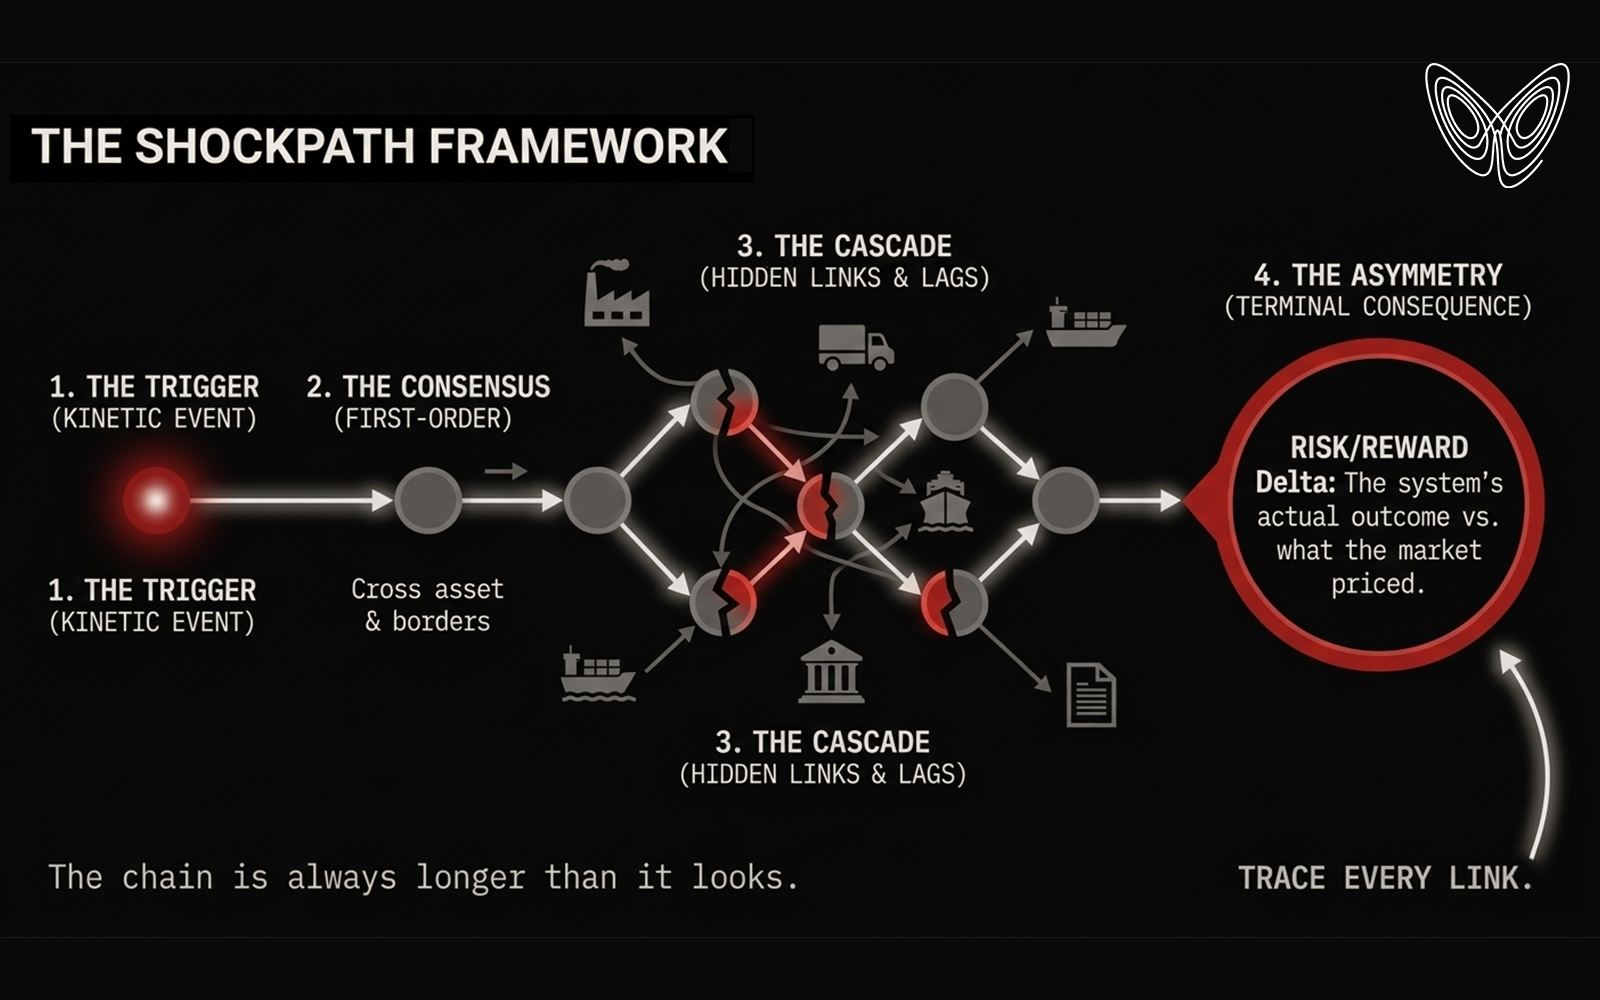
The Framework
The Shockpath framework used here operates primarily across four layers. Understanding where each layer ends and the next begins is the difference between reacting to a headline and understanding what the headline actually set in motion.
The entry point is always the event itself. The kinetic trigger. A central bank surprise, a pipeline disruption, a geopolitical event. It is visible, quantifiable, and it absorbs approximately 95% of financial media attention. The Nord Stream 1 turbine maintenance delay in June 2022. The SNB floor removal in January 2015. The “Ever Given” at 05:40 UTC. These are the entry points. They are not the analysis.
The market's first answer is the consensus reaction. The market identifies the most obvious beneficiary or casualty and prices it within hours. Gas supply drops, gas prices rise. Currency devalues, exporters rally. This layer is usually efficiently priced. European TTF gas futures jumped 30% on the Nord Stream news. That is the consensus reaction. It is correct. It is also incomplete.
Then the chain crosses asset classes and borders through dependencies that the first-order reaction did not trace. It is governed by lag structures — the time required for an input shortage to exhaust an inventory, for a price spike to trigger a margin call, for a regulatory change to drain liquidity from an asset class. High gas prices in Europe led to the curtailment of 70% of European ammonia production by September 2022. Ammonia is the primary input for AdBlue, the diesel exhaust fluid without which modern logistics fleets cannot legally operate in most jurisdictions. The shockpath ran from a pipeline in the Baltic to the question of whether trucks could move at all. The consensus reaction was gas prices. The cascade was the potential halt of continental freight.
The asymmetry lives in the gap that opens after. The gap between what the market priced at the consensus layer and what the terminal consequence actually was. This is where the risk-reward lives. If consensus attention is fixed on gas prices, but the structural risk is a logistics breakdown, the asymmetry is found in positions on logistics-heavy equities or volatility instruments on consumer goods.
The SNB Floor Removal (January 2015)
On January 15, 2015, the Swiss National Bank removed the 1.20 floor on the EUR/CHF exchange rate without warning. The CHF appreciated 30% against the Euro within minutes. The Swiss Market Index fell 13% as the market priced the impact on Swiss exporters. This was the consensus reaction. Efficient, fast, and focused on the obvious.
The shockpath, however, was already moving east. In Poland, approximately 550,000 mortgages, representing roughly 7.7% of GDP, were denominated in Swiss francs. Within 48 hours of the SNB announcement, monthly payments for those households had jumped 20% in local currency terms. These were not traders. They were families with mortgages, now carrying a currency they never chose to be exposed to, absorbing a shock they had no mechanism to hedge.
The chain extended further into the brokerage layer. FXCM, then the largest US retail FX broker, found that client losses had exceeded account equity. The firm faced a $225 million capital shortfall. Alpari UK declared insolvency within 24 hours. The market had priced the currency in seconds. The systemic risk to Polish consumer credit and the structural collapse of the retail FX brokerage model took days to fully manifest. By then, the headlines had already moved on.
MiFID II And the Coverage Vacuum
Institutional shockpaths are slower and more invisible than monetary ones. On January 3, 2018, the European Union implemented MiFID II, mandating the explicit unbundling of investment research costs from trading commissions. The consensus anticipated a decline in research budgets. Large banks prepared to reduce their research headcount. Correct in direction. Incomplete in scope.
Between 2018 and 2020, sell-side analyst coverage of European firms declined by an estimated 10 to 15%. The attrition, however, was not uniform. It concentrated in the segment least able to absorb it. Research coverage for small-cap stocks — those with market capitalizations below one billion euros — collapsed. In the UK, 70% of fund managers reported a decrease in small-cap research volume within 12 months. The chain ran from a transparency regulation to a change in bank profit models to the structural abandonment of an entire segment of the equity market.
Without analyst coverage, institutional and retail interest in small-caps retreated. Without that interest, liquidity dried. Small-cap valuations in Europe began trading at a persistent 20 to 30% discount to their historical averages relative to large-caps. That discount is not a temporary dislocation. It remains a feature of the market today, years after the regulation that created it has been largely forgotten. The chain ran from a transparency mandate in Brussels to a structural repricing of an entire asset class.
The Mechanism That Deserves Attention
Applying this framework to current markets means identifying the structural bottlenecks, ideally, before the event, not after.
In commodities, the relevant question is never the price of the headline input. It is the essential minor input with no dedicated coverage. If neon gas supply from Ukraine is disrupted, the shockpath is not higher neon prices. It is lower global semiconductor manufacturing capacity, because neon is the critical medium in excimer lasers used in chip lithography. The input with no dedicated coverage is frequently the one that shuts down the system downstream.
In rates, the relevant question is the lag structure embedded in fixed-to-floating transitions. When the Fed hikes, the consensus prices the 2-year yield. The actual shockpath runs 18 months forward, to the moment when small-business revolving credit facilities reset to rates that cannot be serviced. The event and its consequence are separated by a gap that quarterly earnings cycles were not designed to see.
In equities, the relevant question is where the information vacuums are forming. Industry consolidation and regulatory change both create coverage gaps that precede liquidity discounts. The MiFID II example is instructive precisely because the mechanism was visible in advance to anyone tracing the chain from the regulatory text to the bank P&L to the research budget to the analyst headcount to the coverage universe. The chain was there. Most policymakers did not follow it past the first link.
Three Chains Currently In Motion
Commercial real estate defaults represent an entry-point event whose cascade — a credit contraction at small and regional banks — runs on a 6 to 12 month lag that the current pricing of bank equities does not fully reflect.
A JPY carry trade unwind represents an entry-point event whose cascade — forced liquidation propagating through Mexican peso and broader EM carry positions — can manifest in 72 hours to two weeks, faster than most institutional risk managers can reposition.
Restrictions at the Panama or Suez Canal represent an entry-point event whose cascade — agricultural fertilizer shortages driven by natural gas input disruptions — runs on a 3 to 6 month lag that commodity markets tend to price only after the inventory exhaustion is already visible.
Tracing shockpaths is not forecasting. It is inventory management — a systematic accounting of dependencies that tend to be hidden in plain sight. Legislative procedure. Shipping law. Chemical supply chains. The institutional structure of Eastern European mortgage markets. The role of neon in semiconductor fabrication. These are not obscure specializations. They are the connective tissue of the system. They are where the chain runs after the front-page headlines stop.
What This Publication Does
Every piece of analysis published here starts at the entry point and follows the chain. Not because the second and third links are hidden. They are visible to anyone willing to trace them. But markets treat every event as the destination.
Here, it is the starting point.
That gap — between where consensus attention ends and where the consequence actually lands — is not a flaw in the system. It is the system.